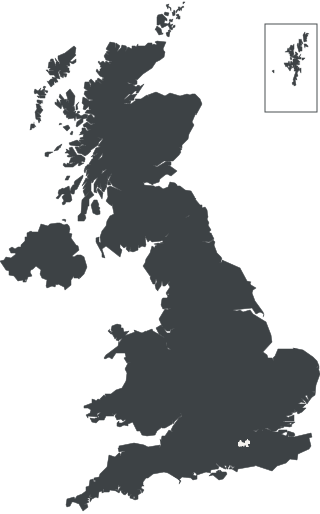
Guildford
£523,974
average house price
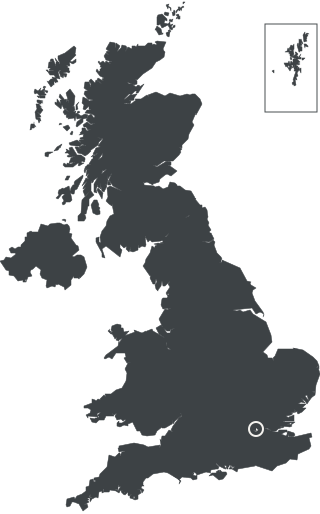
Kensington and Chelsea
?
more, or less?
UK house prices
Two of 79 — one shows its average house price, the other hides it. Say whether the hidden one is more or less and keep going. A tie counts as correct; one wrong answer ends the run, including a near miss within 10%.
Everybody in Britain carries a house price map, and almost nobody drew their own. It was sketched by the friend who moved out of London, the relative who did well selling in the nineties and the property programme on in the background, and it has one shape: a hill with London on top, sloping away north and west. At the ends it is reliable. Nobody needs telling that a borough of garden squares costs more than a Lancashire mill town. In the middle, where most of the pack lives, the map is a rumour. An island off north Wales and a city in central Scotland turn out to cost the same to within a thousand pounds, and two cities that feel like rivals turn out to be separated by less than the price of a used car. In June 2026 Manchester and Leeds were £1,856 apart. The map in your head does not have a pencil that fine, and that is where the game is.
Why the intuition fails
The map prices a place by its name, and the figure prices a boundary. When you think of Manchester you picture a city, with its centre, its suburbs and its reputation. The card prices the authority called Manchester, which is a line drawn for running bins and schools, and it includes whatever happens to be inside that line and nothing outside it. Salford is a separate card, across the river.
Boundaries cut the other way too. Highland is one authority covering a stretch of Scotland larger than Wales, taking in Inverness, the glens and a great deal of empty coast, and its average came out above Sheffield's in the June 2026 figures. Nothing about either name predicts that. The Isle of Anglesey sat above Birmingham in the same release. An island, priced as a whole, is compared with a city priced as its council area, and the instinct that cities cost more has nothing to hold on to.
So the useful question is never "is this a nice place" but "what exactly is inside the line", and that is a question almost nobody has ever asked about the town they live in.
What the data is and what it is not
The list leans in ways worth stating. Sixty-two of the seventy-nine places are in England, eight in Scotland, six in Wales and one — Belfast — in Northern Ireland, which is roughly how the UK's population splits and not at all how its geography does. London is heavier still, because each borough is its own authority: the capital arrives as sixteen cards, and the dear end of the pack is almost entirely London as a result.
The awkward thing is how much a small, expensive borough moves. Westminster's average was £1,144,822 in June 2025 and £854,198 a year later, a fall of a quarter. That is not an error and not a crash. It is what an average does when it rests on comparatively few sales of very different homes, and it means Westminster's card is the one most likely to look strange next month.
One thing nearly went wrong in the fetching. HM Land Registry names its places in English and Welsh, and not only the Welsh ones — Westminster has a Welsh name too. Asked for a label without saying which language, the source hands back either, so about half the time the pack would have dealt a card reading Dinas Westminster, and a spot check on any given day might not have caught it.
Questions
- Why these seventy-nine places?
- Because a person chose them, and the bar was a place a UK player has heard of as a place. No number could make that choice here. The usual measure of fame, a count of the Wikimedia pages about something, puts Shetland Islands at a hundred and Manchester at six, because the page everyone links to is the city and the one tied to the council area is not. So the list is hand-picked, and the prices beside it are not: a person types no figures.
- Why is Bath not in the pack?
- Because HM Land Registry does not price Bath. It prices Bath and North East Somerset, which also takes in Keynsham and the Chew Valley, and a card reading "Bath" beside that figure would be a claim about Bath that nobody has measured. The same rule leaves out Chester, Blackburn and Bournemouth, each inside a larger authority. Where the formal name only dresses up the same place, as with City of Glasgow, the card simply says Glasgow.
- Is this what a house costs there?
- It is the average price across every kind of home sold in the area — flats and detached houses, cash buyers and mortgaged ones, first-time buyers and everyone else. It is not an asking price, and it is not the index figure published beside it. That index measures growth since January 2023, which is why Westminster can sit a third below the UK’s own figure on the index while its homes cost three times as much.
- How accurate are the figures?
- They are HM Land Registry’s own, not a calculation of ours, taken from the same data as its monthly statistical release — checked against that release, they match to the pound. The caveat is theirs too: the newest month is a provisional estimate, and it is built from completed sales, so a small area with few transactions moves more between releases than a large one. A price here is a good figure for the month it names, and not a valuation.
- Does the pack change?
- Yes. The House Price Index is published every month, about seven weeks after the month it describes, and each release revises the twelve months before it as late sales are registered. So a price in this pack can change while the month beside it stays the same. That is the source working as documented, and the pack is regenerated as the releases land.
- Can I play it without JavaScript?
- You can read all of it and see the opening pair, because the page is built as HTML before anything runs. Guessing needs JavaScript, since there is no server to send a guess to.
Where the figures come from
Contains HM Land Registry data © Crown copyright and database right 2026. This data is licensed under the Open Government Licence v3.0. Retrieved 2026-09-14.
HM Land Registry's average price for each local authority, across all property types and buyers, for the most recent month the UK House Price Index publishes. The newest month is provisional. A few names are shortened where HM Land Registry's label is the same place written formally — City of Glasgow is Glasgow here — but never where the area is larger than the town it is named after. HM Land Registry's published attribution wording gives the year as 2020; the line above states the year this data was retrieved.
Maps drawn from ONS Local Authority Districts (May 2025) and Countries (December 2025) boundaries, ultra generalised. Source: Office for National Statistics licensed under the Open Government Licence v.3.0. Contains OS data © Crown copyright and database right 2026.